Top Diagrams

Featured

The following are the most popular business diagrams on our site:

BCG Matrix

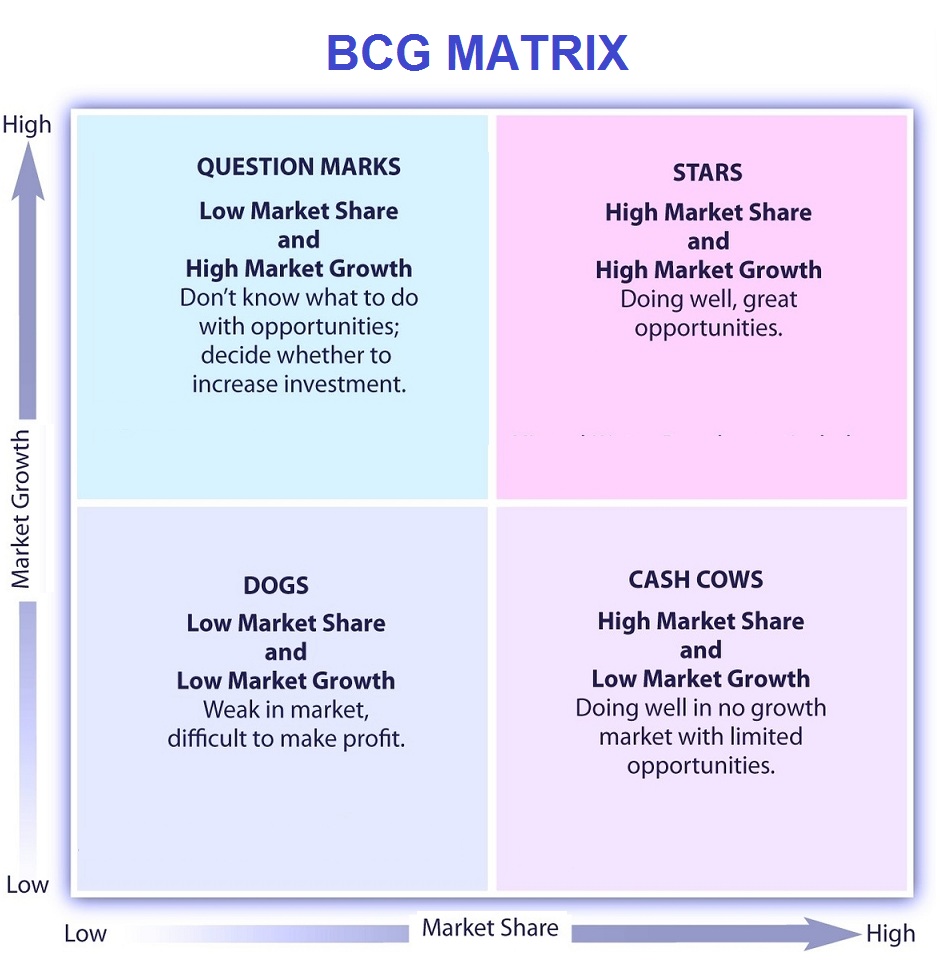
BCG Matrix – BCG Matrix Analysis – Bcg Matrix Framework – Bcg Matrix Business Methodology – Bcg Matrix model categorizes companies and products by the type of market they are in. Matrix has four quadrants divided by the market growth and market share on each of the axis.

Each of the quadrants in the bcg matrix represents a certain market position and is depicted by a symbol a star, which stands for high growth, high market share; the cow (also known as a cash cow) stands for high market share and low growth, a dog for low market share and low growth and a questin mark, which represents high growth but low market share. BCG Matrix developed by the BCG consulting company is one of the top business frameworks. Below sample images are examples of bcg matrix used in business management.

bcg matrix

bcg matrix sample

Swot Analysis

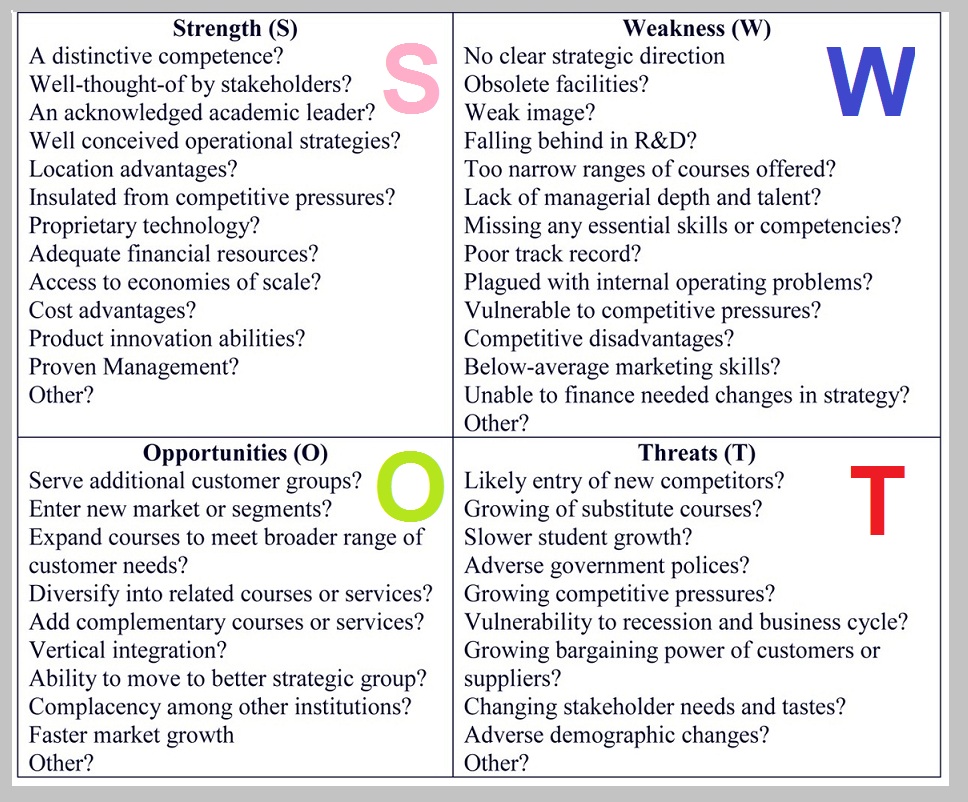
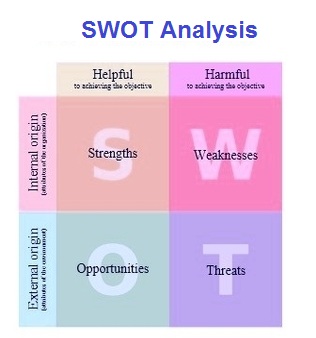
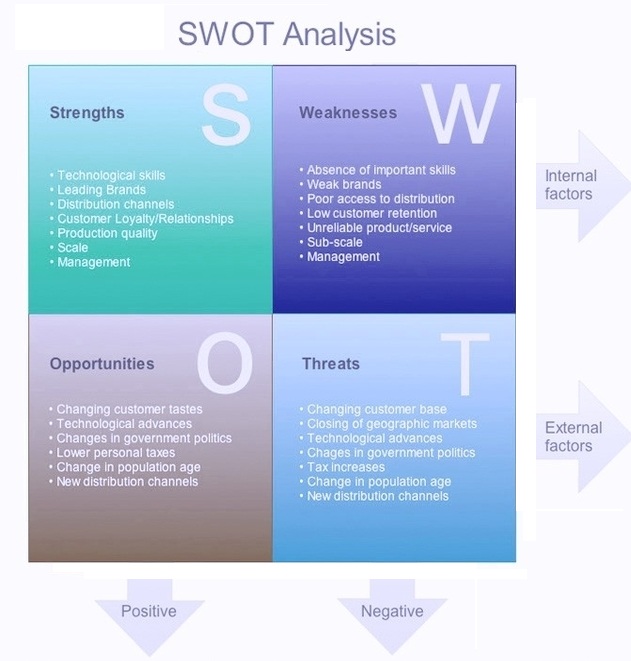
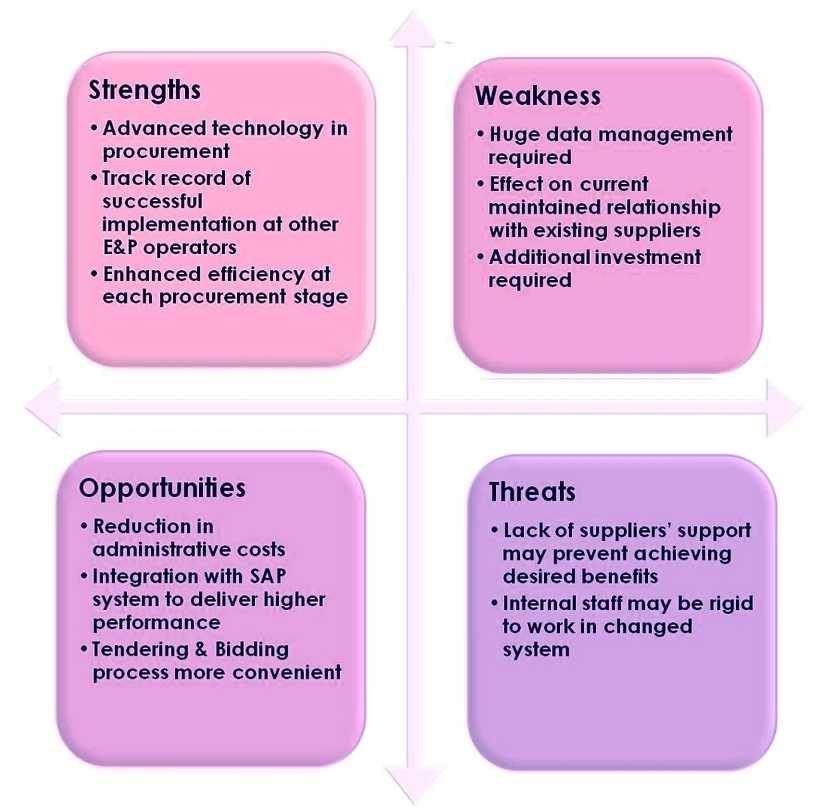
Swot Analysis Swot Analysis – Swot Analysis Framework – Swot Analysis Business Methodology – Swot Analysis model is an approach to solving business problems that identifies Strengths, Weaknesses, Opportunities and Threats facing a company.

While strengths and weaknesses are internal factors, opportunities and threats are external. Understanding of the SWOT variables helps formulate company’s business strategy. Below sample images are examples of swot analysis used in business management.

swot analysis explained

swot-analysis

swot

swot

sample swot analysis

swot-analysis-sample

swot analysis

swot-analysis

Top Business Diagrams

Below are the most popular business-related diagrams and charts as rated by our users:

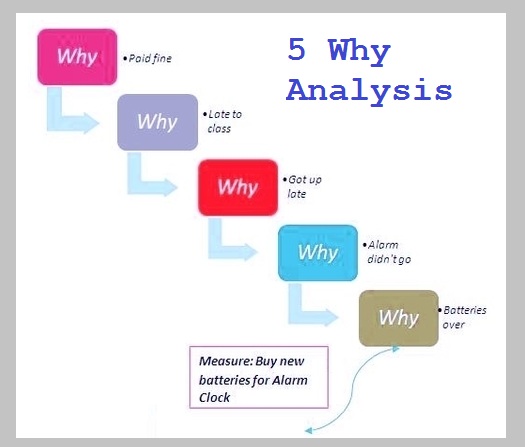
5 Why Analysis 5 Why Analysis – Lean framework to get to the root cause of an issue or a defect
Swot Analysis Swot Analysis – Strengths, Weaknesses, Opportunities and Threats business framework
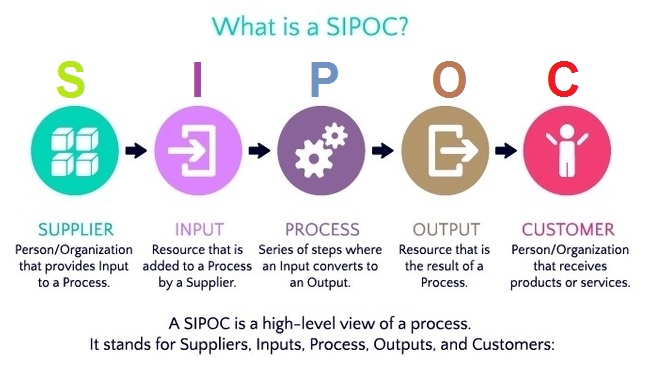
Sipoc Sipoc – High level view of the process inputs and outputs
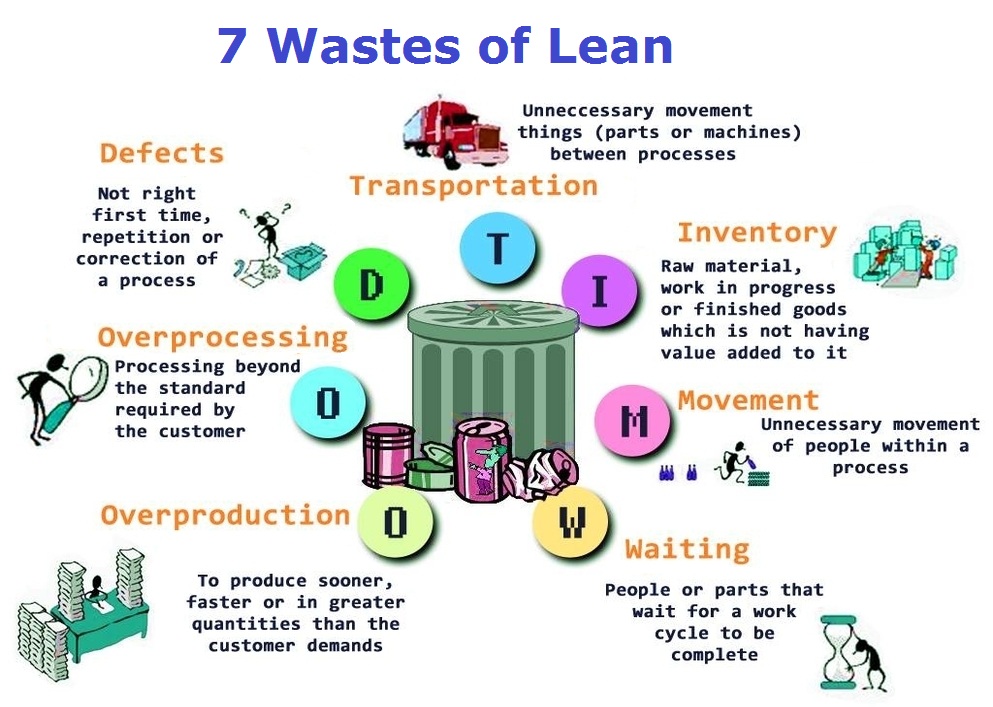
7 Wastes 7 Wastes – Lean types of waste to be eliminated
Affinity Diagram Affinity Diagram – Brainstorming technique for organization of information in logical categories
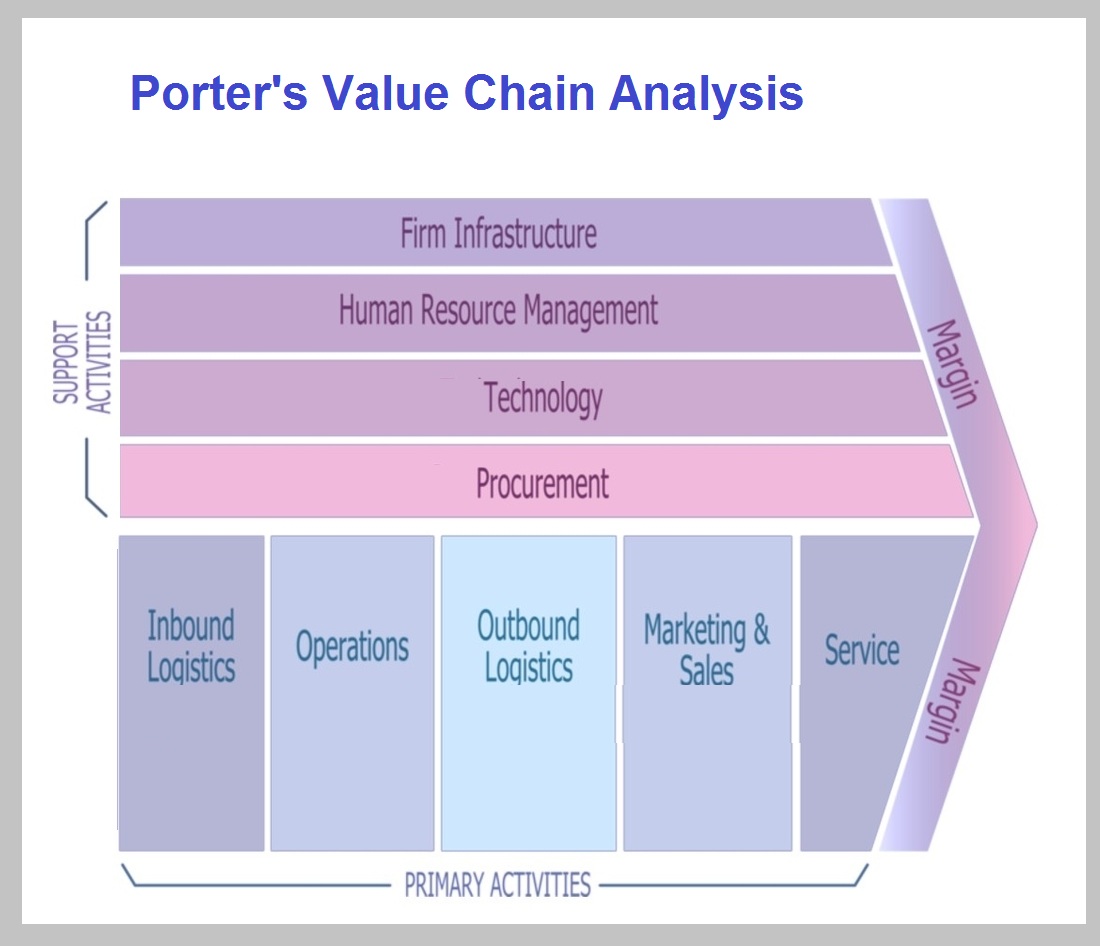
Porters Value Chain Porters Value Chain – Internal analysis by Michael Porter looking at company’s value chain
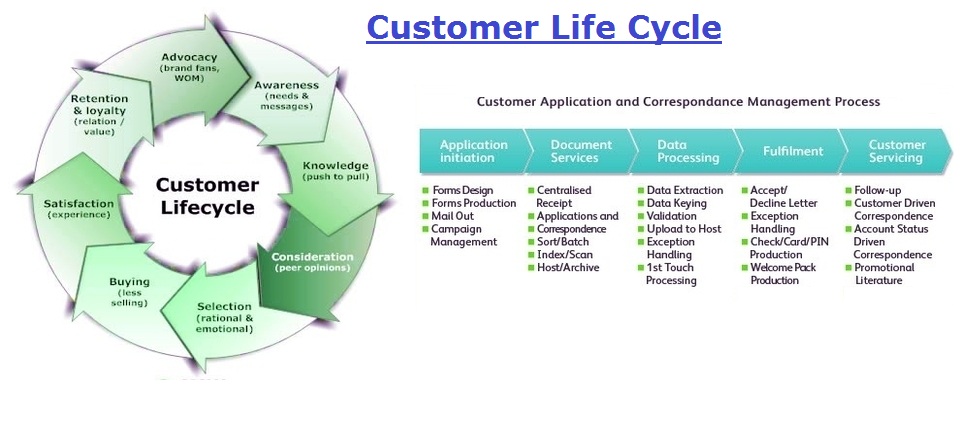
Customer Lifecycle Customer Lifecycle – Model that acknowledges the client lifecycle
BGC Matrix BGC Matrix – Business framework for analyzing company’s market position
End-to-end Process End-to-end Process – Business Process Management framework looking at processes start to finish
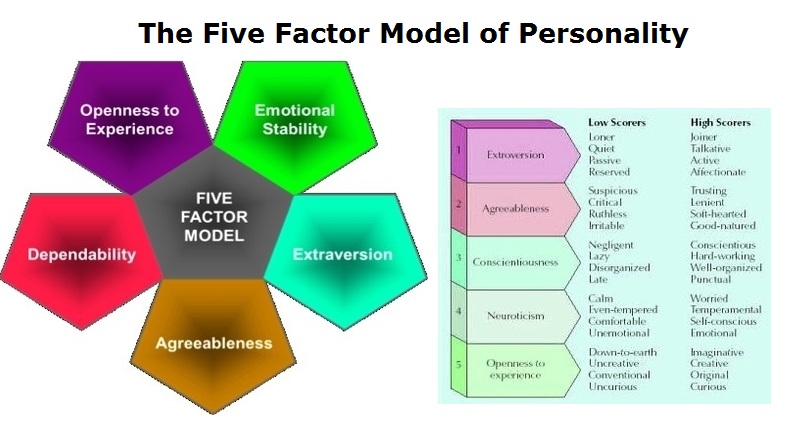
Five Factor Model of Personality Five Factor Model of Personality – Model that analyzes personality traits
CDStep Marketing Diagram CDStep Marketing Diagram – Marketing framework that analyzes various business environmental factors
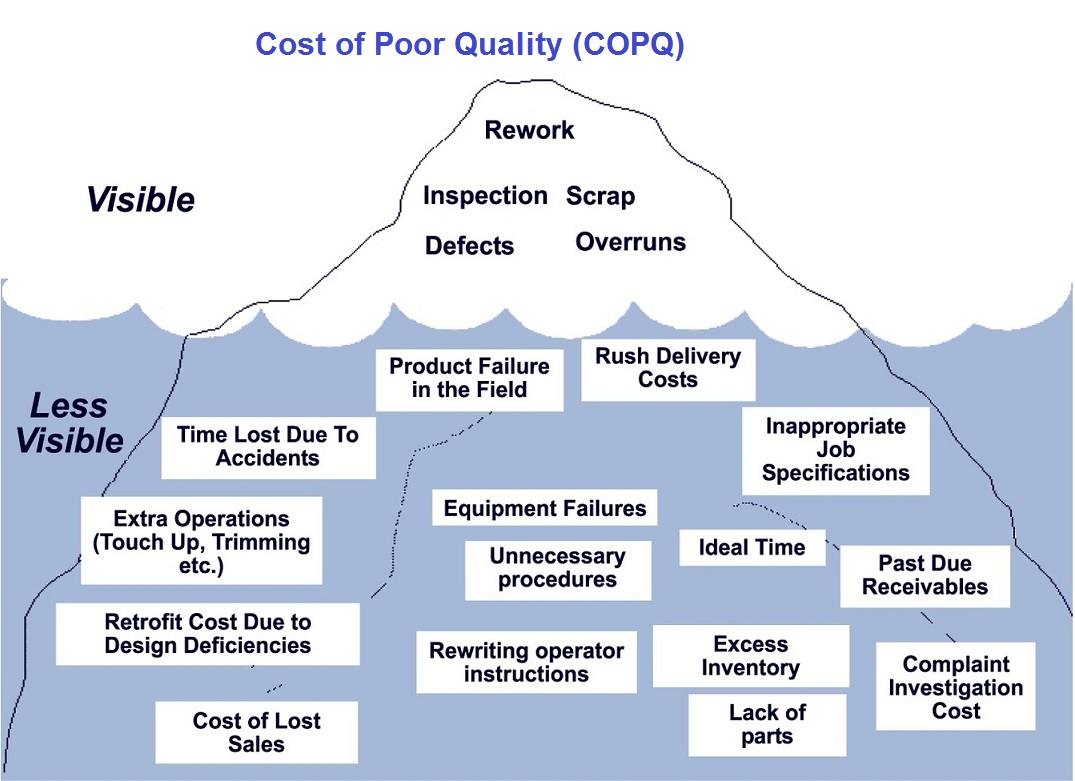
Cost of Poor Quality COPQ Cost of Poor Quality COPQ – Lean framework that recognizes that quality comes at a cost
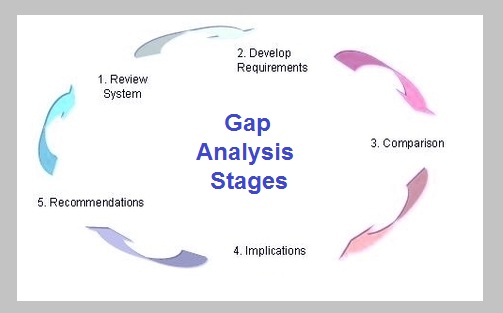
Gap Analysis Gap Analysis – Presentation of business performance gaps against benchmarks
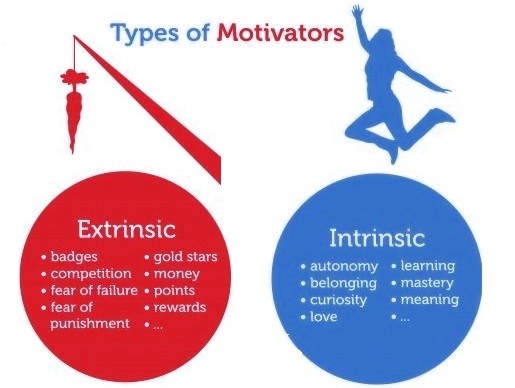
Intrinsic Motivation Intrinsic Motivation – Diagram showing the difference between two types of motivations at the workplace
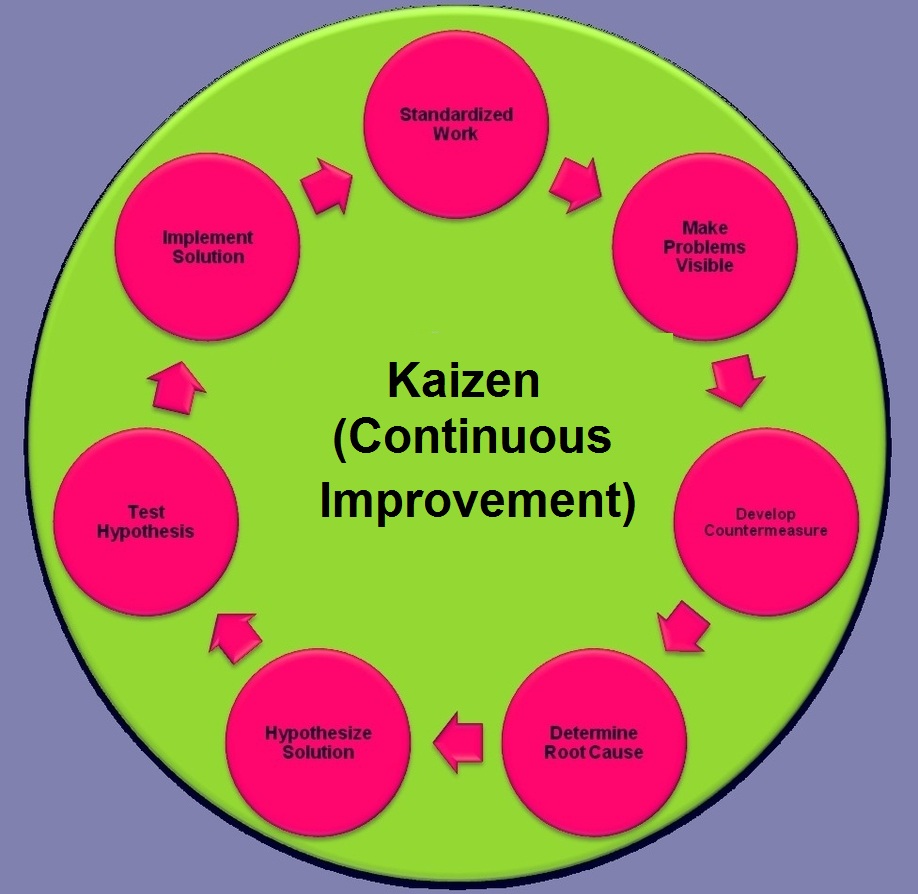
Kaizen Kaizen – Lean methodology for continuous improvement and waste elimination

7 Wastes

7 Wastes – Seven Wastes – 7 Wastes of Lean – This lean six sigma methodology (also known as 8 wastes) helps identify waste and other types of issues in the workplace. The 7 wastes framework includes defects, transportation, inventory, overprocessing, movement, overproduction and waiting.

Defects are wasted products completed not right the first time around. Inventory and overproduction are excessive quantities of raw materials or finished products. Transportation and movement are unnecessary movement of things or people. Overprocessing is making the product beyond customer expectations and waiting is simply waiting for materials, preventing timely completion of products. 7 Wastes Analysis – 7 Wastes Framework

7 wastes

7 wastes