Improving Processes

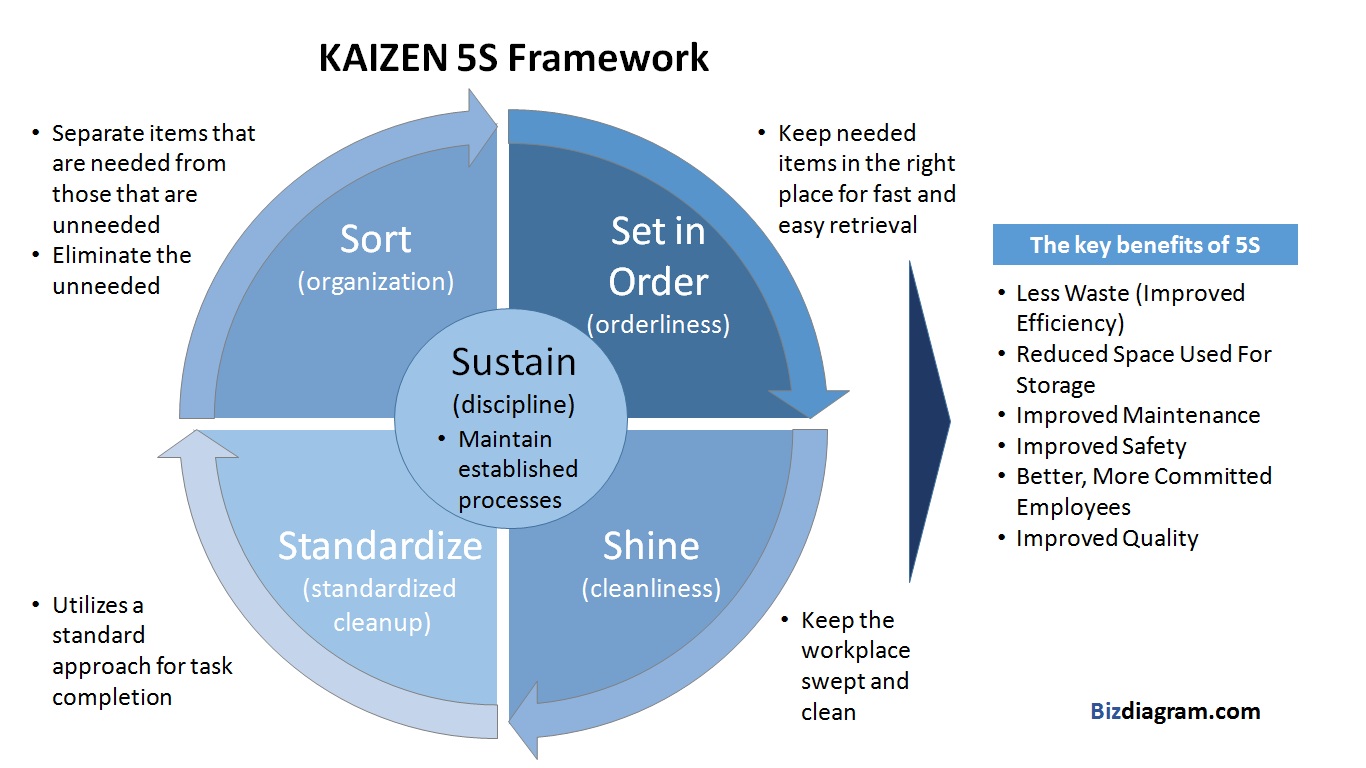
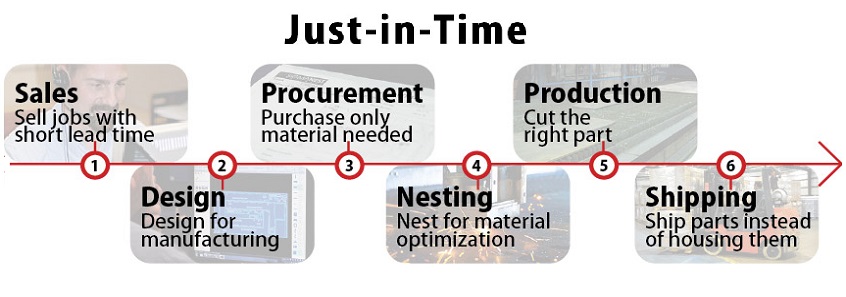
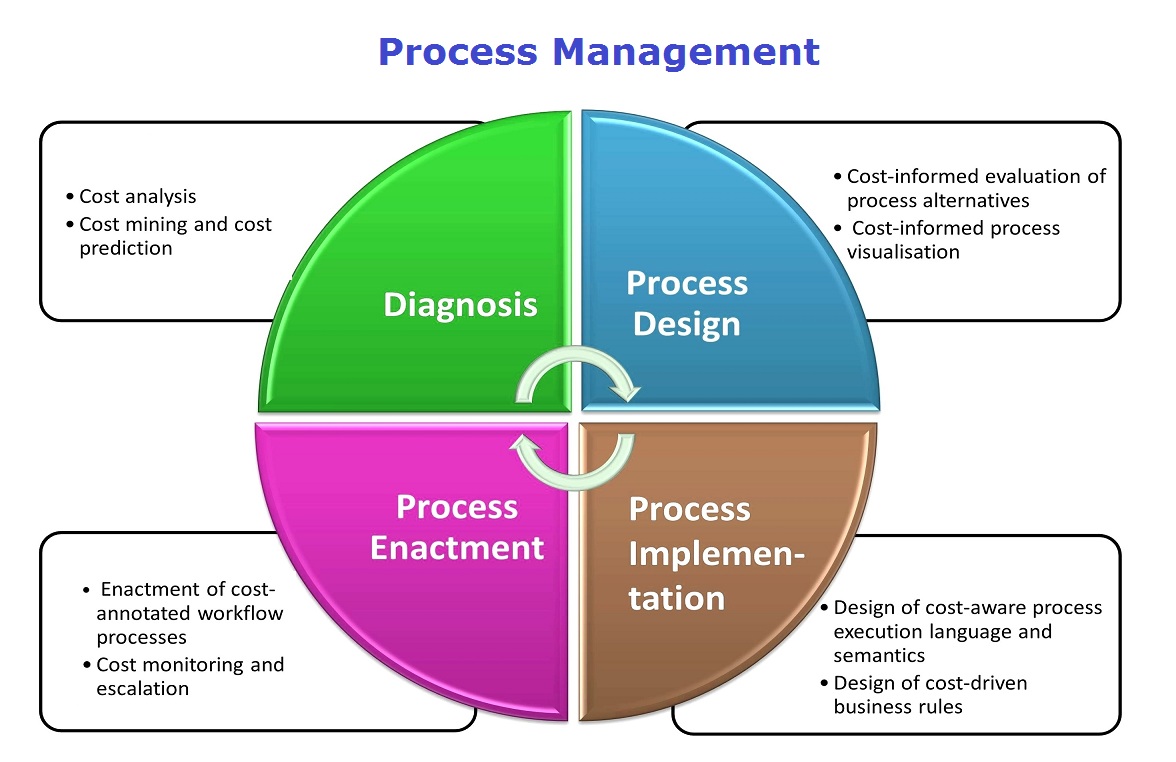
Process improvement is the practice of optimizing processes to improve quality, performance, speed, or anything else that can make a process more efficient and provide a better experience for users and employees. There are different methodologies that businesses can use to improve their processes, including Six Sigma, Lean, and Business Process Management (BPM).

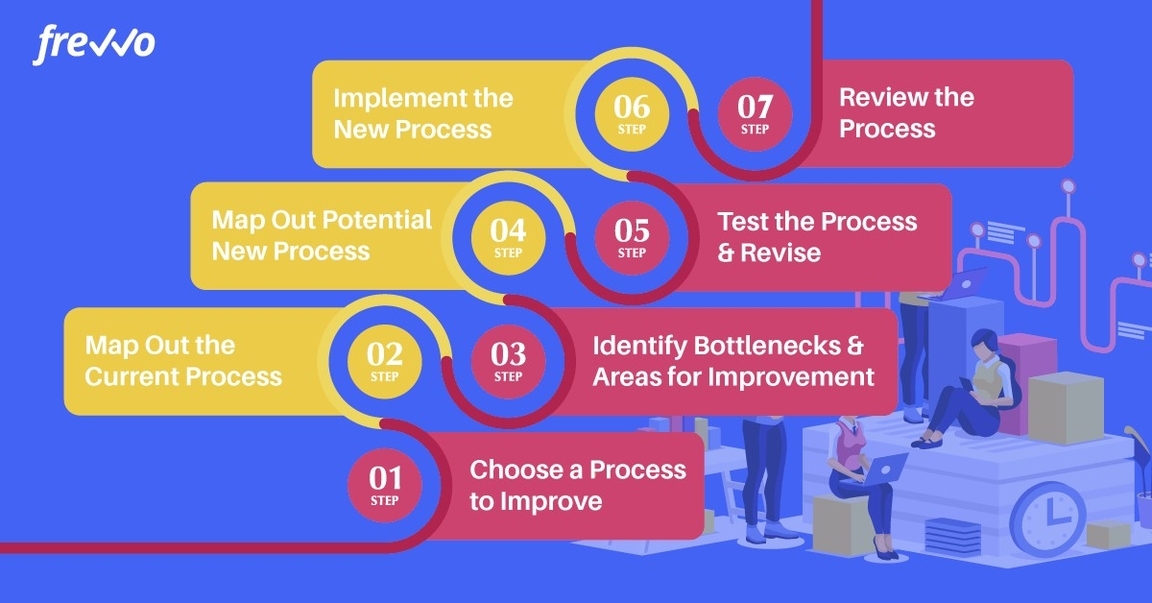
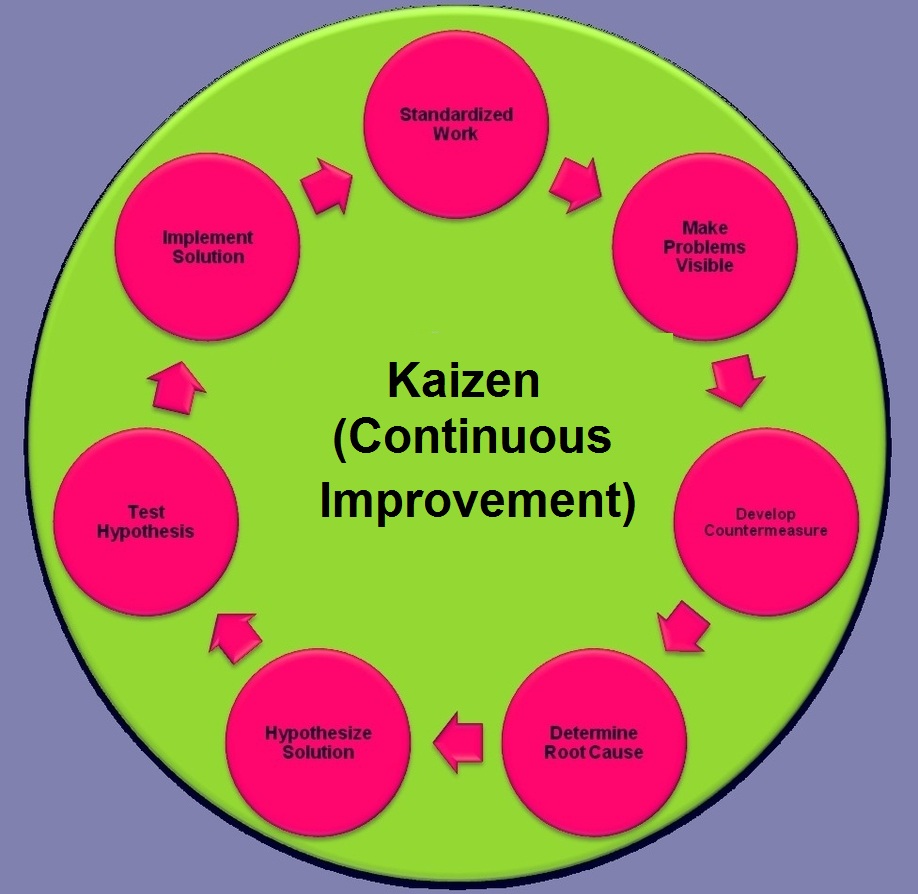
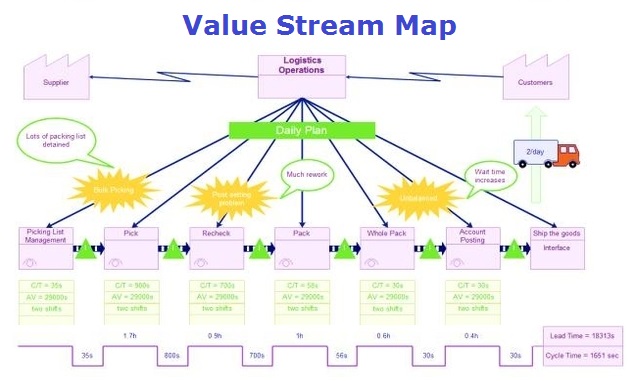
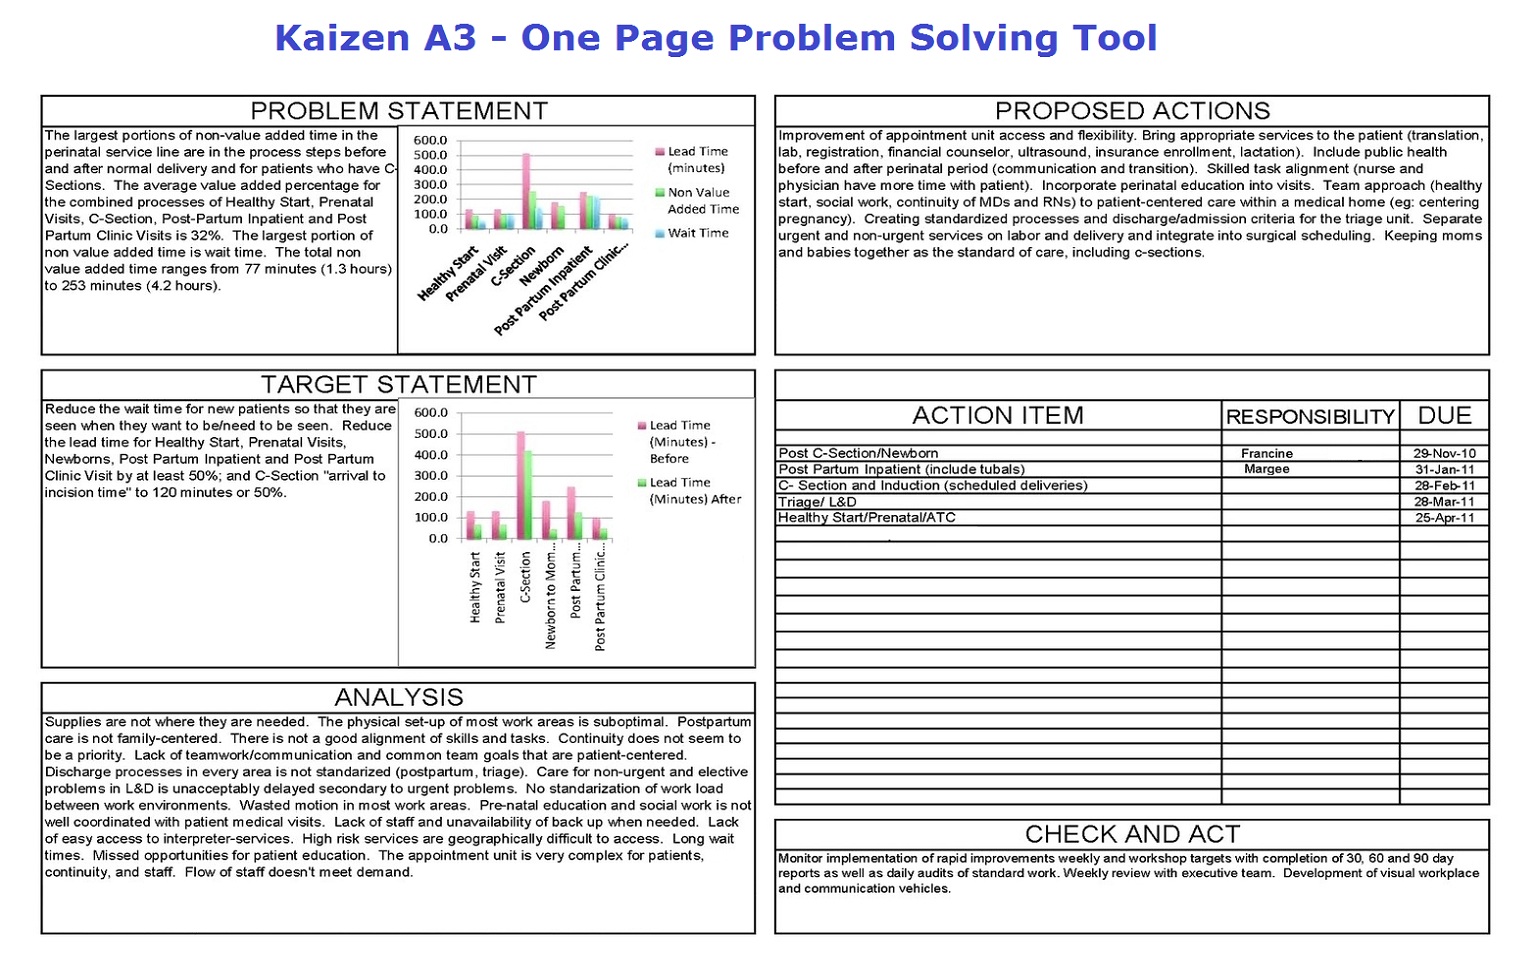
The first step in improving processes is to choose a process to improve. This process should be one that is critical to the business and has the potential to provide significant benefits when improved. Once a process has been selected, the next step is to map out the current process. This involves identifying all the steps involved in the process and documenting them.

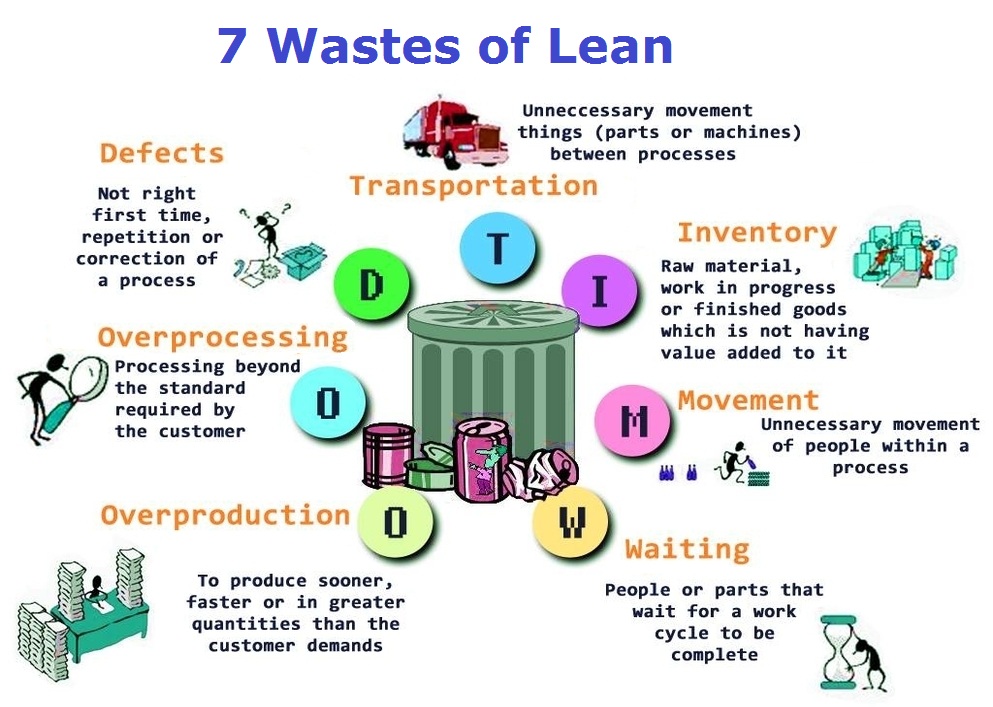
The third step is to identify bottlenecks and areas for improvement. This involves analyzing the current process to identify areas where there is waste, duplication, or inefficiency. Once these areas have been identified, the next step is to map out the potential new process. This involves designing a new process that eliminates the bottlenecks and inefficiencies identified in the current process.

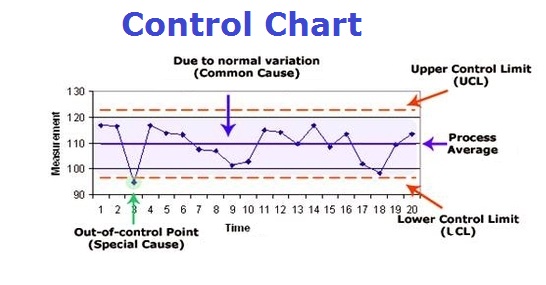
The fifth step is to test the new process and revise it as necessary. This involves implementing the new process on a small scale and monitoring its performance. If the new process is successful, it can be rolled out on a larger scale. If the new process is not successful, it may need to be revised and tested again.

Finally, the new process should be implemented. This involves training employees on the new process and ensuring that they have the necessary resources to implement it effectively. The new process should also be monitored to ensure that it is achieving the desired results.

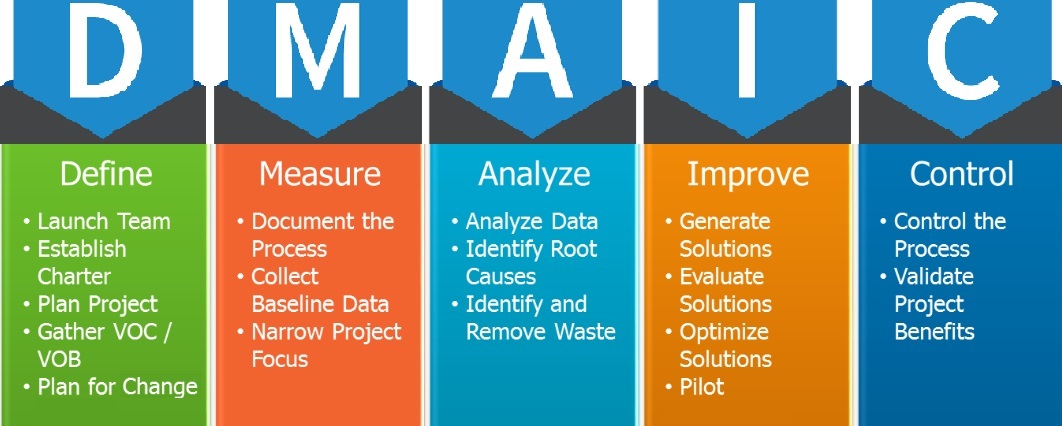
In conclusion, process improvement is a critical component of any business. It helps businesses optimize their processes to improve quality, performance, speed, or anything else that can make a process more efficient and provide a better experience for users and employees. There are different methodologies that businesses can use to improve their processes, including Six Sigma, Lean, and BPM. The process of improving processes involves choosing a process to improve, mapping out the current process, identifying bottlenecks and areas for improvement, mapping out the potential new process, testing the new process and revising it as necessary, and finally implementing the new process.

Improving Processes

Sipoc Process Mapping

SIPOC process mapping is a tool used to map and understand business processes. It stands for Suppliers, Inputs, Process, Outputs, and Customers. A SIPOC diagram documents your business’s suppliers, inputs, process, outputs, and customers. It provides a high-level view of a process by visualizing how everyone in the process receives materials or data from each other. SIPOC diagrams are often used to improve or understand processes associated with customer experience .

The SIPOC process mapping methodology is a simple way to visualize how each piece of the process fits together. It is a type of workflow diagram that focuses on who creates and receives materials or data throughout a business process. SIPOC diagrams are just one tool for business process management (BPM). BPM is a tool for the continuous improvement of business processes. It involves investigating processes, planning how to improve them, and implementing those improvements with strategic initiatives .

To create a SIPOC diagram, follow these seven steps :

1. Choose a process: Select the process you want to visualize with your SIPOC diagram. This can be a new business process you want to implement or an existing process you want to improve.
2. Define the process: Define the process you want to map out. This involves identifying all the steps involved in the process and documenting them.
3. List the outputs: Identify the outputs of the process. This involves identifying what the process produces and documenting it.
4. Identify the customers: Identify the customers of the process. This involves identifying who receives the outputs of the process and documenting it.
5. List the inputs: Identify the inputs of the process. This involves identifying what the process needs to function and documenting it.
6. Identify the suppliers: Identify the suppliers of the process. This involves identifying who provides the inputs to the process and documenting it.
7. Create the SIPOC diagram: Create the SIPOC diagram using the information you have gathered.
IPOC diagrams provide a high-level process map to help stakeholders make decisions and brainstorm improvement ideas. They aren’t meant to provide too much detail, but rather give decision-makers key information about each process. SIPOC diagrams are often used in lean project management as part of the Six Sigma process improvement methodology. Six Sigma aims to minimize defects and inconsistencies in an end product—for that reason, it works well to improve manufacturing or any process associated with customer experience .

In conclusion, SIPOC process mapping is a tool used to map and understand business processes. It provides a high-level view of a process by visualizing how everyone in the process receives materials or data from each other. SIPOC diagrams are often used to improve or understand processes associated with customer experience. To create a SIPOC diagram, follow the seven steps outlined above. SIPOC diagrams are just one tool for business process management (BPM) and are often used in lean project management as part of the Six Sigma process improvement methodology.

Sipoc Process Mapping

Six Sigma Dmaic Diagrams

Six Sigma DMAIC is a data-driven quality strategy used to improve processes. DMAIC stands for Define, Measure, Analyze, Improve, and Control. It is an integral part of a Six Sigma initiative, but in general can be implemented as a standalone quality improvement procedure or as part of other process improvement initiatives such as lean . The DMAIC process is a structured approach to problem-solving that can be used to identify and eliminate defects in a process. It is a five-step process that involves defining the problem, measuring the process, analyzing the data, improving the process, and controlling the process.

The first step in the DMAIC process is to define the problem. This involves identifying the problem and its impact on the business. The second step is to measure the process. This involves collecting data on the process and analyzing it to identify areas for improvement. The third step is to analyze the data. This involves using statistical tools to identify the root cause of the problem. The fourth step is to improve the process. This involves implementing solutions to address the root cause of the problem. The fifth and final step is to control the process. This involves monitoring the process to ensure that it remains stable and that the improvements are sustained.

DMAIC diagrams are used to visualize the DMAIC process. They are a type of flowchart that shows the steps involved in the DMAIC process. DMAIC diagrams are often used to communicate the DMAIC process to stakeholders and to help them understand the process. DMAIC diagrams can be created using a variety of tools, including Microsoft Visio, Lucidchart, and SmartDraw.

The DMAIC process is a powerful tool for improving processes and eliminating defects. It is a structured approach to problem-solving that can be used to identify and eliminate defects in a process. DMAIC diagrams are a useful tool for visualizing the DMAIC process and communicating it to stakeholders. By following the DMAIC process and using DMAIC diagrams, businesses can improve their processes and provide better products and services to their customers.

In conclusion, Six Sigma DMAIC is a data-driven quality strategy used to improve processes. DMAIC diagrams are used to visualize the DMAIC process. The DMAIC process is a structured approach to problem-solving that can be used to identify and eliminate defects in a process. DMAIC diagrams are a useful tool for visualizing the DMAIC process and communicating it to stakeholders. By following the DMAIC process and using DMAIC diagrams, businesses can improve their processes and provide better products and services to their customers.

Six Sigma Dmaic Diagrams

Fishbone Root Cause Diagram

Fishbone root cause analysis diagram (also known as Ishikawa diagram) is used to identify key root causes for issues affecting certain aspects of your business. It categorizes root causes into categories, which make sense to your situation. However, often People, Machines (Technology), Procedures, Processes are used as categories for the root cause analysis. Fishbone is really what the root cause diagram looks like with issues in the head of the diagram. This analysis is often used in the A stage of the Lean Six Sigma DMAIC approach.

Fishbone Root Cause Diagram

Process Map

Process Map – Process Map Analysis – Process Map Framework – Process Map Business Methodology – Process Mapping is a tool to documenting business processes and is an effective way to think about the inefficiencies associated with each process step. Process mapping is used as part of the Lean Six Sigma toolkit. There may be few process levels with Level 1 usually representing the high level view, level 2 is more detailed with level 3 focusing on procedural.

Key process map symbols include boxes, which represent steps and procedures, diamonds are decision points.
Below sample image is an examples of a Process Map used in business management with legend and explanations on what each symbol means.

process map

process map

5S Kaizen Framework

5S – Kaizen 5S – 5S Analysis – Five S – 5S Framework – 5S Business Methodology – 5S model is an approach to solving business problems. Below sample images are examples of 5S used in business management.

5S is a Lean Six Sigma structured method to getting a workplace cleaned up (eliminating waste), organized, standardized and then sustaining the improvements made. Five S name is based on the five Japanese words starting with S. Below is the image of this framework and key benefits of 5S model.


5s

5s

5 Why Analysis

5 Why – 5 Why Analysis – Five Why – 5 Why Framework – 5 Why Business Methodology – 5 Why model is one of the fundamental lean six sigma frameworks and is essential in looking for the root cause of waste and business challenges.

Level after level, 5 WHYs are meant to unpeal symptoms to get to the root cause of an issue. The limit is placed on a number five because looking beyond may not be as viable and will probably go as far as a psychological issues of the business owners; Lean recognizes that psychology is not its competence 🙂 and that the focus is to be at a business level. Below sample images are examples of 5 Why-s used in business management.

5 why analysis

5 why

Bullwhip Effect

Bullwhip Effect – Bullwhip Effect Analysis – Bullwhip Effect Framework – Bullwhip Effect Business Methodology – Bullwhip Effect is one of the recongnized recurring issues whereby a sudden spike or a decline in demand from a customer results in much bigger effect on the supply chain.

The longer the supply chain, the more pronounced is the effect with potentially huge variations and volatility for producers of raw materials. Understanding of this effect should limit managers mistakes when it comes to overproduction, ordering of goods and meeting customer demand. Below sample images are examples of Bullwhip Effect.

bullwhip effect

bullwhip effect

Kaizen Continuous Improvement

Kaizen – Kaizen Analysis – Continuous Improvement – Kaizen Framework – Kaizen Business Methodology – Kaizen model is a lean approach to continuous improvement of business processes and is at the heart of the Lean Six Sigma philosophy.

Kaizen worldview or mind frame is meant to be a continuous cycle consisting of the following stages: make problems visible, develop countermeasures, determine root cause of the business issues, hypothesize solution, test hypothesis, implement solution, standardize work. Below sample images are examples of Kaizen used in business management.

kaizen

kaizen

Project Cycle

Project Cycle – Project Cycle Analysis – Lean Project Cycle – Project Stages – Project Cycle Framework – Project Cycle Business Methodology – Project Cycle model developed as part of Lean methodology and is one of the top business frameworks to structure a lean six sigma project.

Project stages are as follows: Request, Scoping, Planning, Training, Redesign, Implementation, Review and Feedback. Below sample images are examples of Project Cycle used for lean project management.

project cycle

lean project cycle

Sipoc

Sipoc – Sipoc Analysis – Sipoc Framework – Sipoc Business Methodology – SIPOC model is high level view of the process that specifies who the suppliers and customers are, what are the inputs and outputs and what is the high level process. Sipoc is one of the key Lean Six Sigma tools.

SIPOC is quick way to document a business process and ultimately be able to resolve a business issue. Below sample images are examples of sipoc used in business management.

sipoc

sipoc diagram

Lean Eight Wastes

8 Wastes – Lean Eight Wastes – 8 Wastes Analysis – 8 Wastes Framework – 8 Wastes Business Methodology – 8 Wastes model also known as seven wastes or eight wastes of lean is one of the top Lean Six Sigma business frameworks aimed at establishing various inefficiencies within an organization.

There were 7 wastes in the lean methodology originally however an 8th waste, namely the waste of human intellect, was added to recognize the importance of human beings and their creativity in the business process. Below sample images are examples of 8 Wastes used in business management.

8 wastes

8 wastes

Cost Of Poor Quality COPQ

Cost Of Poor Quality – COPQ = Cost Of Poor Quality Analysis – Cost Of Poor Quality Framework – Cost Of Poor Quality Business Methodology – Cost Of Poor Quality model is a Lean framework stating that organizations only see symptoms of poor quality such as rework, scrap and rejects. However, what they do not see is that poor quality affects sales, results in longer cycle times and affects many other business aspects.

The classic depiction of COPQ is an iceberg with only a small portion of the symptoms visible above the surface. COPQ is a Lean Six Sigma approach to solving business problems. Below sample images are examples of Cost Of Poor Quality used in business management.

cost of poor quality

cost of poor quality

Value Stream Map

Value Stream Map – Value stream map is a lean tool used to depict end-to-end process that a product or a service goes through from initial placement of the order to completion in the hands of the customer. This is often used to analyze the current state processes and design the future state process. Value stream mapping is used in manufacturing, service industries such as financial industry, logistics, healthcare, software and product development, etc. Value stream maps usually have standard symbols to depict activities.

The proper value stream map should separate value-adding processes from the non-value add activities. Another way to separate is by the type of activities, e.g. information flow vs. materials flow. Lead time is usually represented at the bottom of the value stream map to represent the total elapsed time for the order to get to the customer. Note, lead times are viewed from customer perspective and are usually longer than cycle times or internal processing times (e.g. lead time would include time in transit). Value stream maps show value adding times and non value adding times. Time spent on non-value add activities is waste (also known as muda in Lean methodology).

value stream map

Just in Time Diagram

Just in time – JIT – The just-in-time concept is one of the Lean tools and is essentially an inventory strategy that prescribes receiving goods only when they are needed thus reducing waste, inventory costs and decreasing capital needed to run the business. In addition, having low inventory can be viewed as more flexible, i.e. if a product does not sell well, you can always switch to something else (both in terms of finished goods and raw materials).

One obvious disadvantage of JIT, it is hard to predict demand and hence sometimes customers will demand products that you have no inventory off, thus decreasing your revenues and creating a client irritant. Nevertheless, adopting the just-in-time strategy can potentially create a cost and efficiency advantage for a business. The just in time diagram below identifies some of the key areas where just in time strategy may be applied.

just in time

Control Chart

Control chart is a chart used to show how a process changes over time with data plotted in time order and relevant measure value on the y-axis. It is one of the 7 basic tools of quality, originally developed by Walter Shewhart. It is often used to determine whether a process needs to go through a formal review and whether everything is within the norm. If there were changes to the process, it will show how the new outputs compare to the historic norms. So let’s explain how control charts work.

Data measurements are plotted against time. A control chart has a central line for the average, a lower line for the lower control limit and an upper line for the upper control limit. These are established from historical data. One can track process outputs and variations by checking current indicators against historical limits. If variation is normal (i.e. within limits) than the process is in control, otherwise the process is out of control and may be affected by the so-called special causes.

Control Chart Example

control-chart-example

control chart

DMAIC

DMAIC is a Lean Six Sigma methodology that is used in reviewing and analyzing processes to come up with various process improvement tactics. DMAIC is an acronym that stands for the five phases of the approach: Define, Measure, Analyze, Improve and Control.

In the Define stage of dmaic, the project would be officially launched, the main business problem identified, project team established and project activities planned (e.g. project charter and project plan developed). In the Measure stage, the team would document the process, collect data (e.g measuring cycle time) and narrow project focus. In the Analysis stage of the DMAIC, project team is to analyze data, identify root causes (e.g. using Ishikawa diagram) and waste (see 8 wastes). In the Improve phase, one would develop recommendations for process improvement, evaluate and prioritize solutions (e.g. develop an implementation roadmap), and conduct a pilot. In the final stage of the DMAIC method, one would implement, control the process and validate project benefits.

dmaic

Process Management

Process Management – Business Process Management – BPM – Process Management Diagram – Business Process Management model is a stream within business management that focuses on the management of company’s processes. Essentially, BPM views a business through the eyes of the process, i.e. all activities are processes in one way or another.

Process Management is about active control of the business activities and involves process mapping, KPI and metrics identification, end-to-end view and oversight. The key process management steps include process design, process implementation, process enactment and diagnosis (analysis)

process management

process management

Kaizen A3 Tool

Kaizen A3 – Kaizen A3 Analysis – Kaizen One Page Problem Solving Tool – Kaizen problem solving tool – Kaizen template – Kaizen A3 Framework – Kaizen A3 is a lean six sigma problem solving tool, which allows to quickly identify the problem, analyze the issues and provide recommendations and action plan with identified owners.

This Lean Six Sigma A3 method was designed as a workshop tool, allowing a work group to stay focused on the problem. Usually, within a span of a day, often within 3 hours, a team can work through a difficult problem and come up with an actionable list of recommendations. All of this fits into 1 page, hence the name – A3.

kaizen a3

kaizen a3 one page tool

7 Wastes

7 Wastes – Seven Wastes – 7 Wastes of Lean – This lean six sigma methodology (also known as 8 wastes) helps identify waste and other types of issues in the workplace. The 7 wastes framework includes defects, transportation, inventory, overprocessing, movement, overproduction and waiting.

Defects are wasted products completed not right the first time around. Inventory and overproduction are excessive quantities of raw materials or finished products. Transportation and movement are unnecessary movement of things or people. Overprocessing is making the product beyond customer expectations and waiting is simply waiting for materials, preventing timely completion of products. 7 Wastes Analysis – 7 Wastes Framework

7 wastes

7 wastes