Category Archives: Analysis
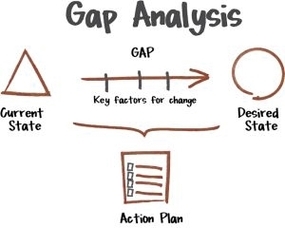
Gap Analysis Framework
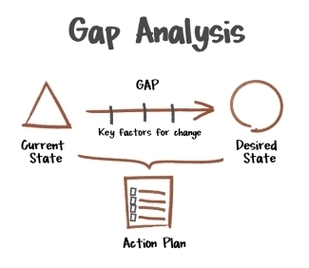
Gap Analysis Current vs Future State
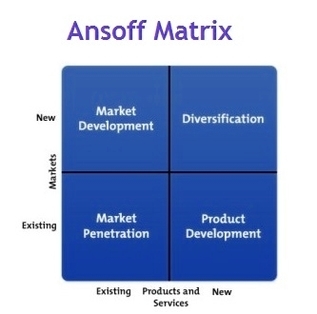
Ansoff Matrix
Gap Analysis Approach
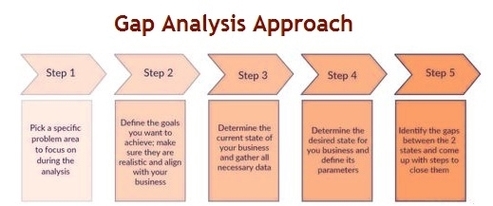
Gap analysis approach is a method of getting from where the business is today vs. where it wants to be in the future. Analyze the current state first, develop a future state and then understand the gap and provide recommendations Continue reading Gap Analysis Approach
Competitive Analysis Table
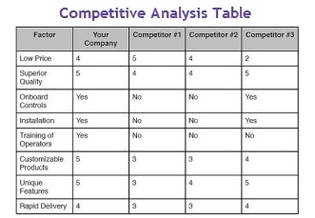
A competitor analysis table summarizes the main similarities and differences between your business and that of your competitors. You can compete more effectively after you have a good understanding of how your competitors operate and what their strengths and weaknesses Continue reading Competitive Analysis Table
BCG Advantage Matrix with Success Path
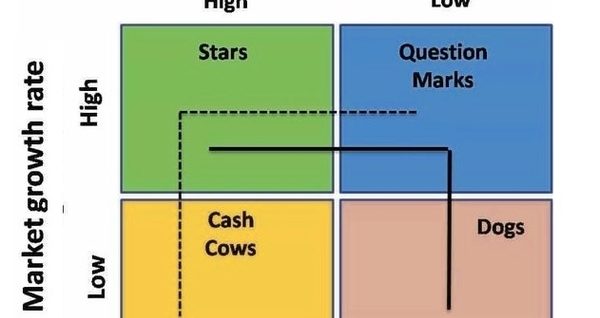
The BCG Matrix shows that business success depends on how cash is allocated over those same products. More precisely high market shares products will also bring high margins and cash and vice versa. Cash cow, dog, star and the question Continue reading BCG Advantage Matrix with Success Path
Different Types of Due Diligence
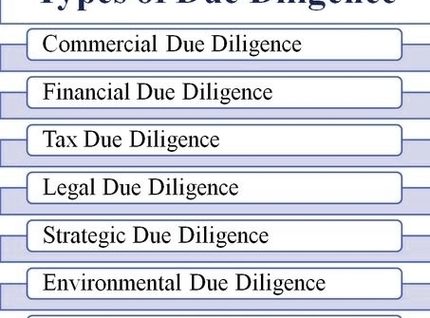
Due Diligence Examples include completing a property inspection before buying a house. The best due diligence processes ensure close collaboration across different departments each with its own set of due diligence type requirement including financial, commercial, M&A, vendor and customer Continue reading Different Types of Due Diligence
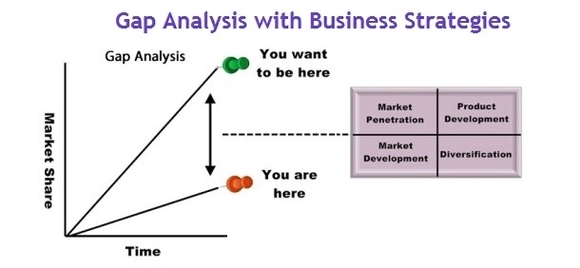
Gap Analysis with Business Strategies
Decision Tree Impact Analysis
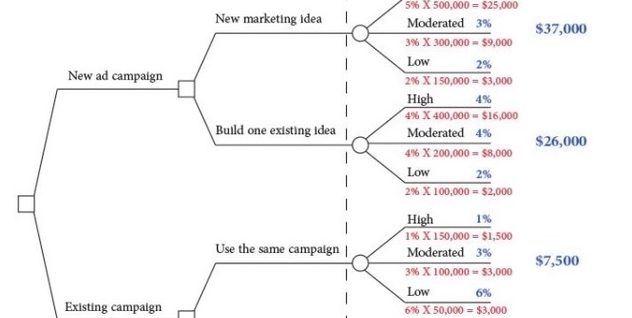
Decision tree is a tool that shows you how to make decisions when facing multiple options. The decision tree analysis implementation steps are to list all the decision, assign the probability of occurrence for each of the outcomes, assign the Continue reading Decision Tree Impact Analysis
Game Theory Matrix
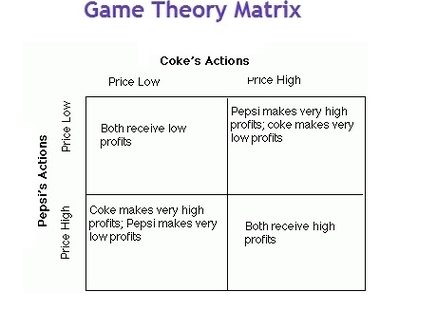
Game Theory Matrix is a table in which strategies of one player are listed in rows and those of the other player in columns. The cells show payoffs to each player. Game theory diagram below is an example of this Continue reading Game Theory Matrix
BCG Matrix Analysis
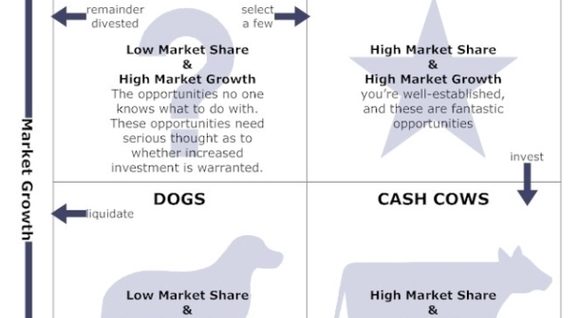
The BCG Matrix is a business framework that explains the lifecycle of products. There are four types of scenarios, Stars, Cash Cows, Dogs and Question Marks. Depending on where you are in the BCG diagram, you should follow a different Continue reading BCG Matrix Analysis
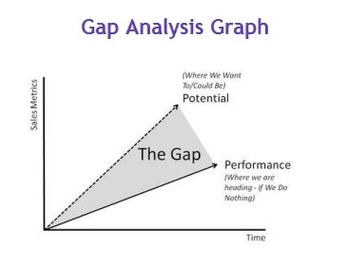
Gap Analysis Graph
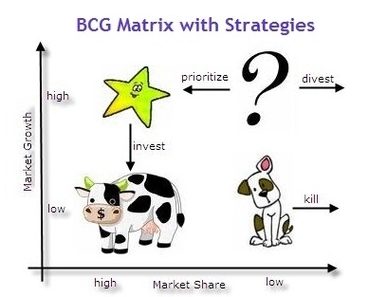
BCG Matrix with Strategies
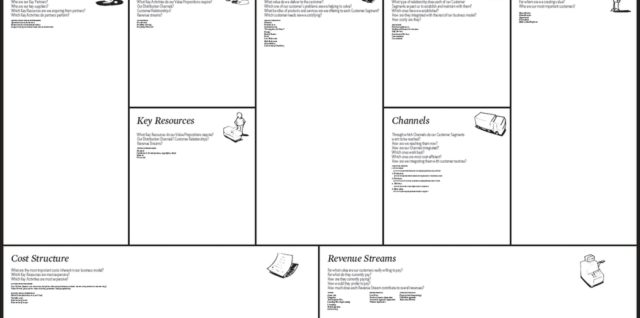
Business Model Canvas
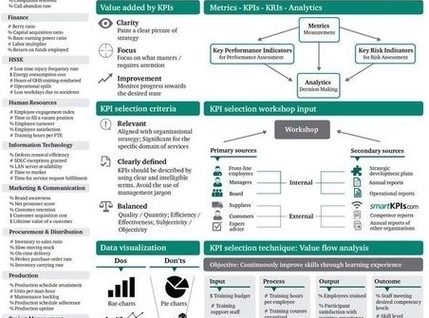
Key Performance Indicators KPI Explained
Gap Analysis Example
GE McKinsey Nine Box Matrix
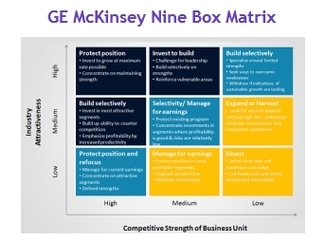
The GE-McKinsey nine-box matrix is a strategy framework that offers a systematic approach for a corpora tion with multiple businesses or products to prioritize its investments. Business units are assessed by their appeal in the industry and strength relative to Continue reading GE McKinsey Nine Box Matrix
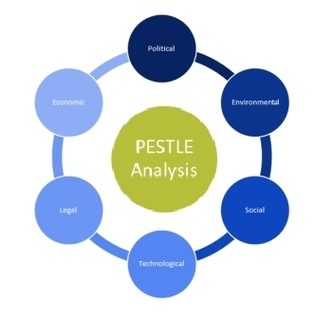
PESTLE Analysis
Fishbone Root Cause Diagram
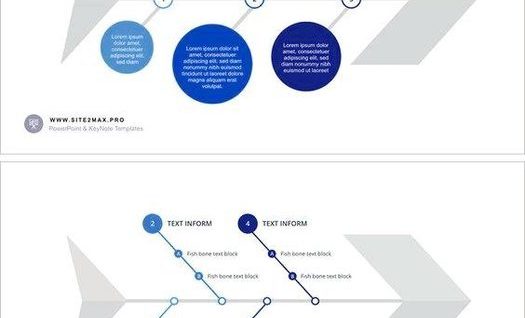
Fishbone root cause analysis diagram (also known as Ishikawa diagram) is used to identify key root causes for issues affecting certain aspects of your business. It categorizes root causes into categories, which make sense to your situation. However, often People, Continue reading Fishbone Root Cause Diagram


