
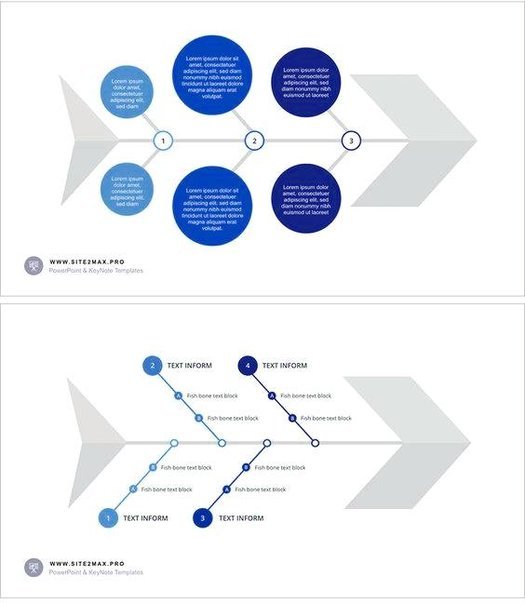
Fishbone root cause analysis diagram (also known as Ishikawa diagram) is used to identify key root causes for issues affecting certain aspects of your business. It categorizes root causes into categories, which make sense to your situation. However, often People, Machines (Technology), Procedures, Processes are used as categories for the root cause analysis. Fishbone is really what the root cause diagram looks like with issues in the head of the diagram. This analysis is often used in the A stage of the Lean Six Sigma DMAIC approach.