Gantt Chart – Gantt Diagram – Gantt Analysis – Gantt charts (also sometimes spelled as a gant chart) is a project management method of displaying multiple project activities in a single view. This includes the duration of activities, dependencies and milestones against calendar timelines.
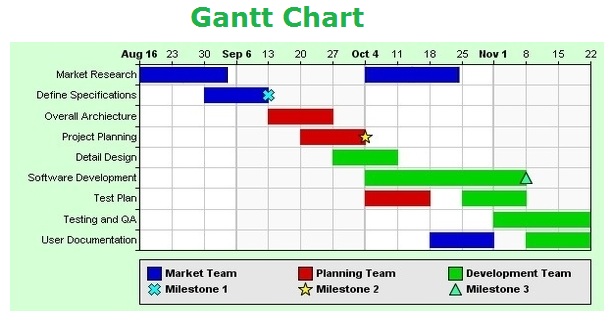
Gantt charts are useful project management tools because they conveniently display project tasks against one another. Below, we include a sample gantt chart.
gantt chart