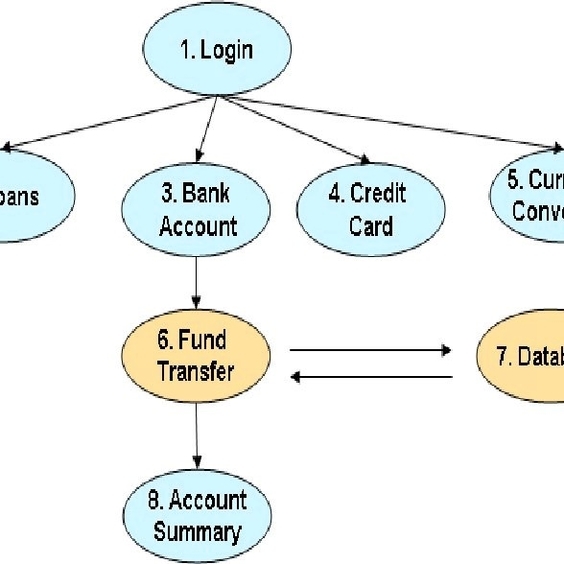
A transactional flowchart is a pictorial representation of a process that shows the sequence of tasks for each activity, the flow of inputs and outputs for each task, and the relationship of tasks involved in each activity . It is used to document processes and procedures and is simple to prepare and update .
Here is an example of a transaction flow graph for an online information retrieval system :
“`mermaid
graph TD;
A[Accept input (tentative birth)] –> B[Validate input (birth)];
B –> C[Transmit acknowledgment to requester];
C –> D[Do input processing];
D –> E[Search file];
E –> F[Request directions from user];
F –> G[Accept input];
G –> H[Validate input];
H –> I[Process request];
I –> J[Update file];
“`
The above graph shows the steps involved in a transaction for an online information retrieval system. The transaction starts with accepting input and ends with updating the file .
