Business Model Infographic
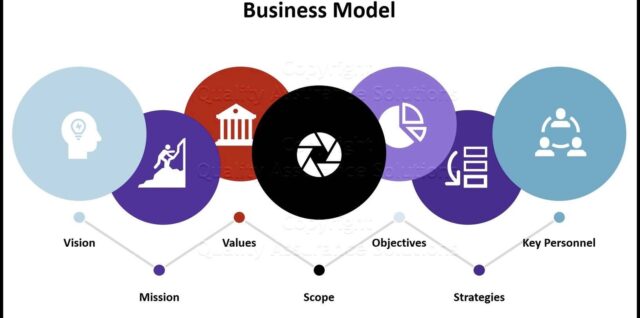
Business model Infographic

Business Model Infographic: A business model infographic visually represents the key components and relationships within a business model. It typically includes elements such as value proposition, customer segments, revenue streams, cost structure, key activities, key resources, and key partnerships. This Continue reading Business Model Infographic

Strategic Planning Models Infographic

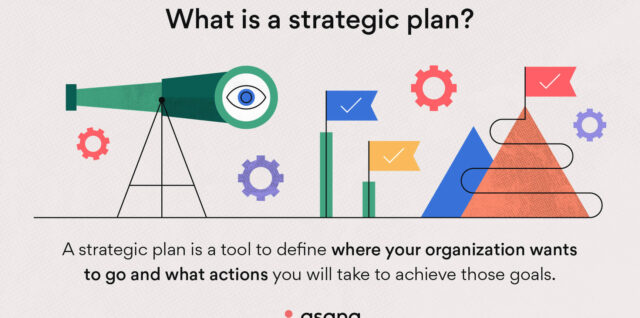
strategic planning models infographic

Strategic Planning Models Infographic: Strategic planning models provide frameworks for setting organizational goals and developing plans to achieve them. Common models include SWOT analysis, PEST analysis, Balanced Scorecard, and Porter’s Five Forces. An infographic can visually represent these models, making Continue reading Strategic Planning Models Infographic

Stress Management Infographics

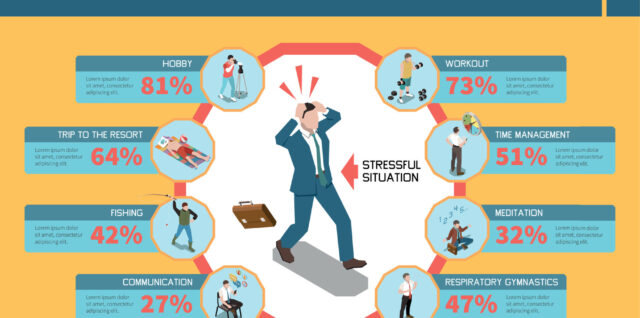
stress management infographics

Stress management infographics: Stress management infographics are visual representations that convey information about stress and its management. They typically include data on stress causes, symptoms, and coping strategies, presented in an engaging and easy-to-understand format. Infographics are effective tools for Continue reading Stress Management Infographics

Business Intelligence Framework Process Infographic

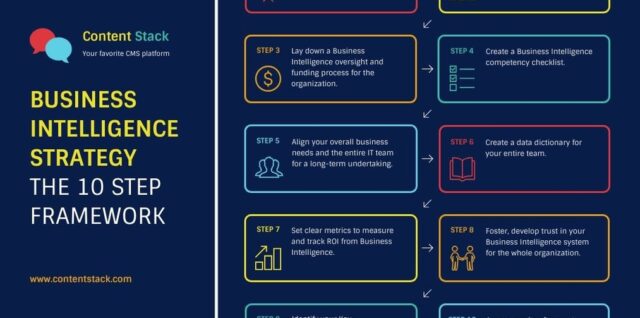
Business Intelligence Framework Process Infographic

Business Intelligence Framework Process Infographic: A Business Intelligence Framework Process Infographic visually represents the process of collecting, analyzing, and using data to make informed business decisions. It includes components such as data sources, data integration, data analysis, and data visualization Continue reading Business Intelligence Framework Process Infographic