
Control Chart
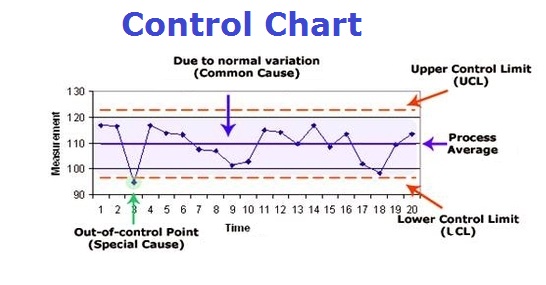
Control chart is a chart used to show how a process changes over time with data plotted in time order and relevant measure value on the y-axis. It is one of the 7 basic tools of quality, originally developed by Continue reading Control Chart