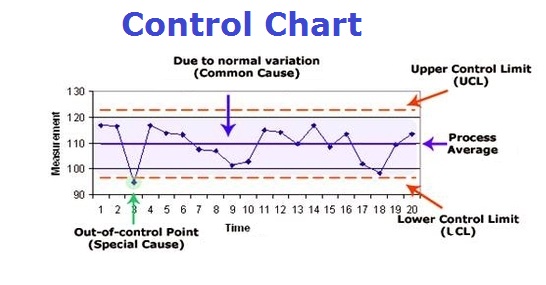
Control chart is a chart used to show how a process changes over time with data plotted in time order and relevant measure value on the y-axis. It is one of the 7 basic tools of quality, originally developed by Walter Shewhart. It is often used to determine whether a process needs to go through a formal review and whether everything is within the norm. If there were changes to the process, it will show how the new outputs compare to the historic norms. So let’s explain how control charts work.
Data measurements are plotted against time. A control chart has a central line for the average, a lower line for the lower control limit and an upper line for the upper control limit. These are established from historical data. One can track process outputs and variations by checking current indicators against historical limits. If variation is normal (i.e. within limits) than the process is in control, otherwise the process is out of control and may be affected by the so-called special causes.
Control Chart Example

