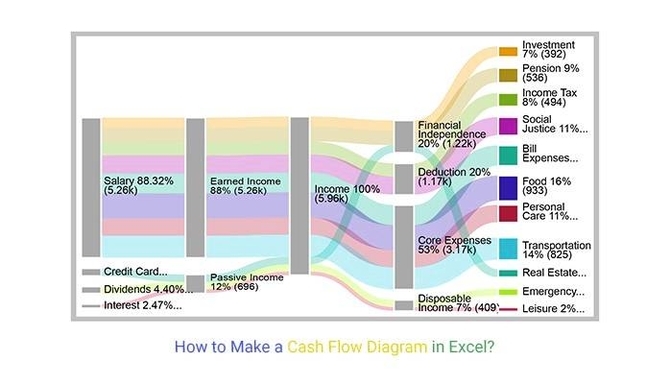
Cash Flow Diagram in Excel: Creating a cash flow diagram in Excel involves inputting cash inflows and outflows, calculating net cash flow, and visualizing the data using charts. This diagram helps businesses track their financial health by showing the movement of cash over a specific period.
